
The quest to find the easiest way to debug PHP is something most PHP and WordPress developers suffer with. Though some developers argue that logging messages to a log file can be a way forward, I must admit, it turns out to be overly complicated when dealing with a complex project, where tracking the execution flow and monitoring changes in variables is important as execution proceeds.
If this is you, then you are on the right post. In this guide, we explore how you can get started with Xdebug and Eclipse PHP Development Tools (PDT) to improve your WordPress development debugging process and sometimes understand existing code.
Ready? Let’s get to it!
Installing Eclipse for PHP development
Let’s start off by installing Eclipse for PHP development. As it provides the essential tools for any PHP developer, including PHP language support.
- Visit https://www.eclipse.org/downloads/packages/
- Scroll down to find and download the Eclipse IDE for PHP Developers variant for your computer. Eclipse provides variants for Windows, macOS, and Linux.
- With Eclipse IDE for PHP Developers downloaded, launch the installer and complete the installation. For macOS users, this typically entails you clicking on the dmg file and copying the Eclipse application into your Applications folder. For Windows-based users, you can follow this simple guide from eclipse.org and for Linux users here’s a great resource to follow.
Installing Xdebug for Eclipse
With Eclipse now installed, let’s dive in and install Xdebug for Eclipse. To do so, please ensure you have Xdebug installed. Installing Xdebug is highly dependent on your system. Hence, depending on your system, please navigate to this section of their documentation to find the one which works for your system.
Once, you’ve installed Xdebug, we can then proceed by configuring it with our already installed Eclipse.
To set up Xdebug as your default debugger in Eclipse, we would need to configure PHP Debug for Eclipse. This setting can be found by navigating to Eclipse > Preferences > PHP > Debug. Please see the screenshot below:
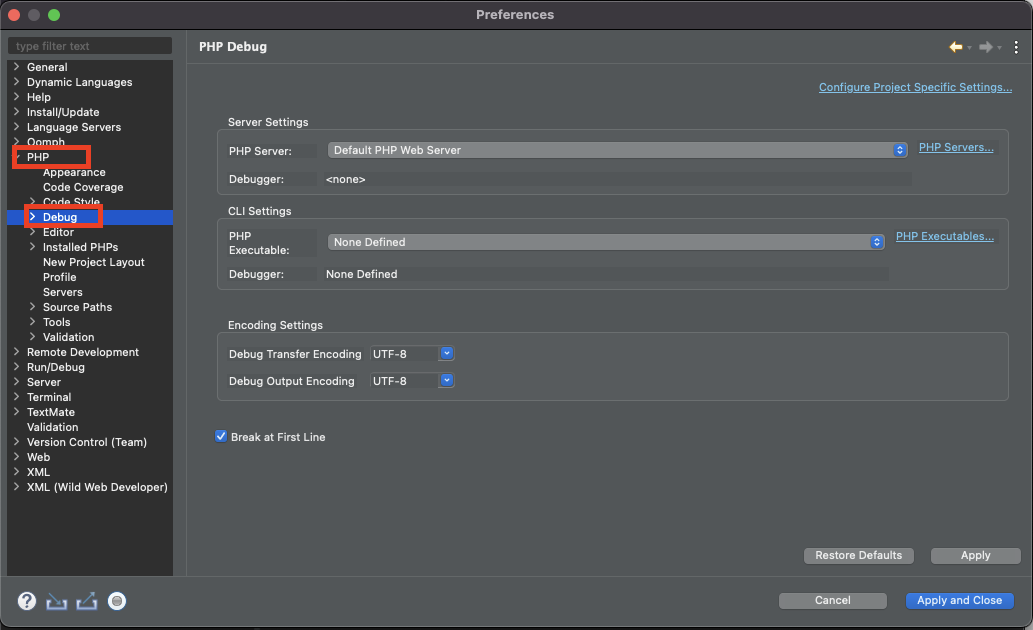
Next, we would need to configure the Default Settings in the Debug Eclipse preference page of PHP.
Configurations
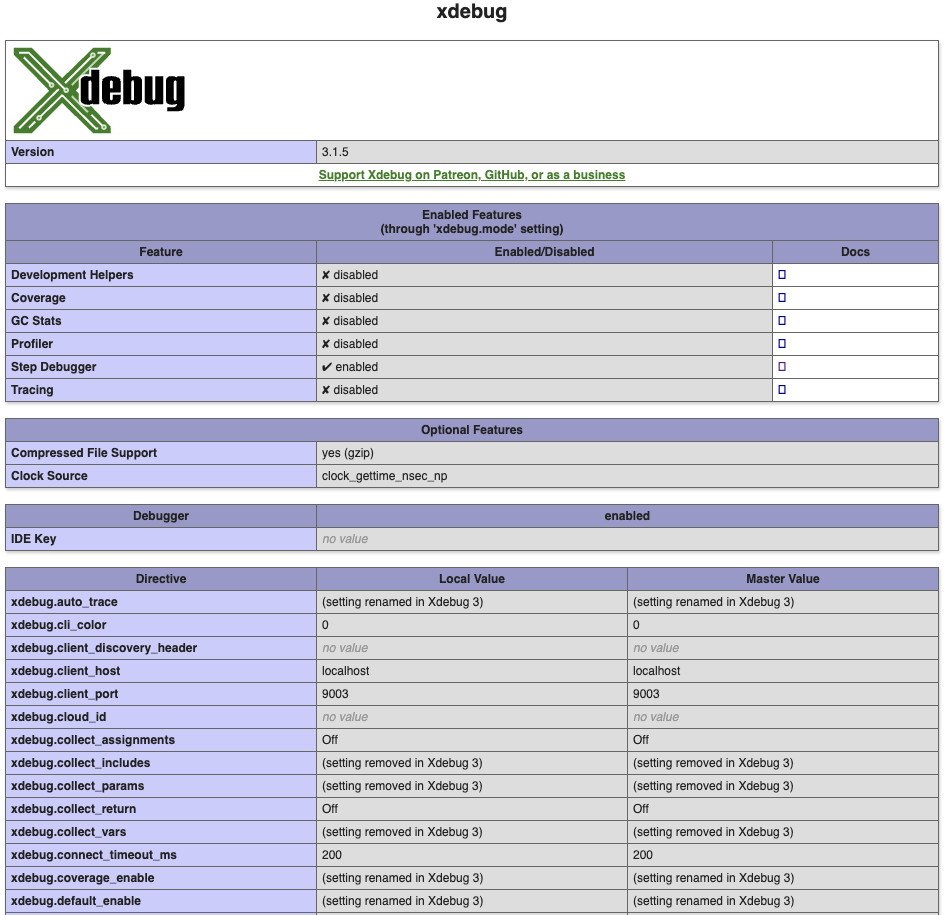
The most important setting for Xdebug to work with PDT is xdebug.remote_enable = 1. Typically you set this value in your php.ini. To verify that your server loads Xdebug, use the phpinfo() function and check if you can find an Xdebug configuration section. If found, then Xdebug is loaded correctly. Please see the screenshot below:
Usage
The following examples assume you’re debugging on a local machine, not a remote server.
We are debugging using the default DocumentRoot (http://localhost).
Configure Server Settings: PHP Server
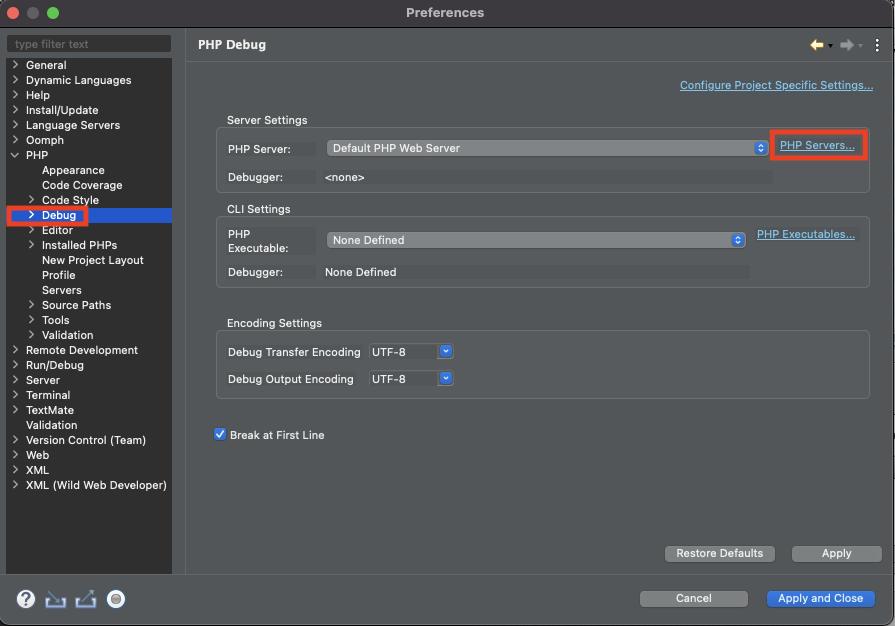
PDT provides a preference dialog to configure different PHP servers. Navigate to Eclipse > Preferences > PHP > Debug. Next in the Server Settings section click on PHP Servers. Please see the screenshot below:
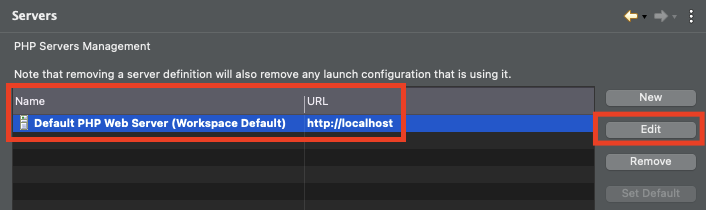
With the Servers dialog open, please select the Default PHP Web Server and click Edit. Please see the screenshot below:
Because each server has a Base URL and a Local Web Root property, which is used in conjunction with the path of the script you’re debugging to determine the absolute URL to open during a debug session, we would need to specify the Local Web Root property. Please see the screenshot below:
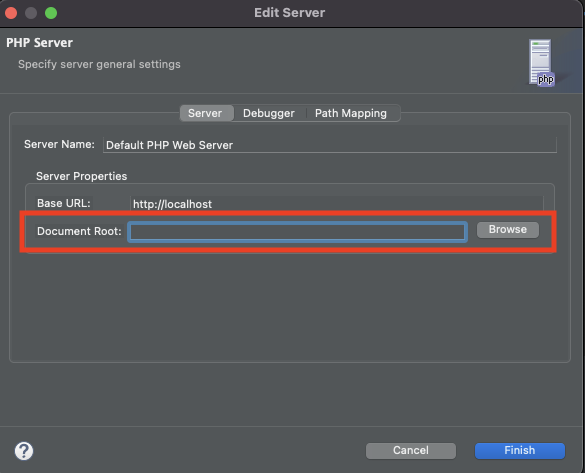
Typically you will set the Local Web Root of the default PHP server (http://localhost) to the Document Root of your local Web server (e.g. apache).
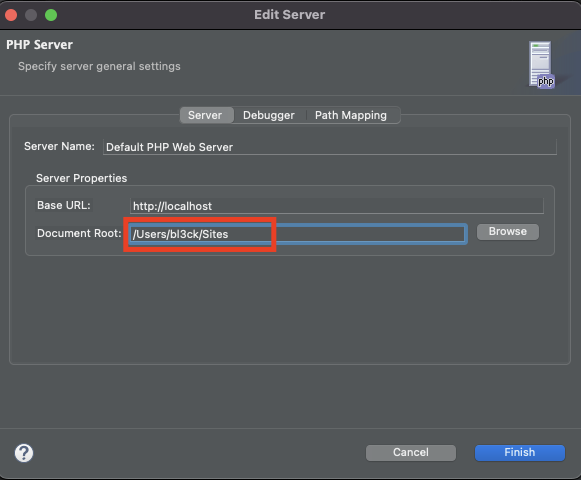
The default PHP server is http://localhost and has no Local Web Root set. So the first thing to do is to open the PHP Servers preference page and set the Local Web Root to the Document Root of your webserver (e.g. /var/www/htdocs). In my case, I am using the Sites folder as my Document Root. Please see the screenshot below:
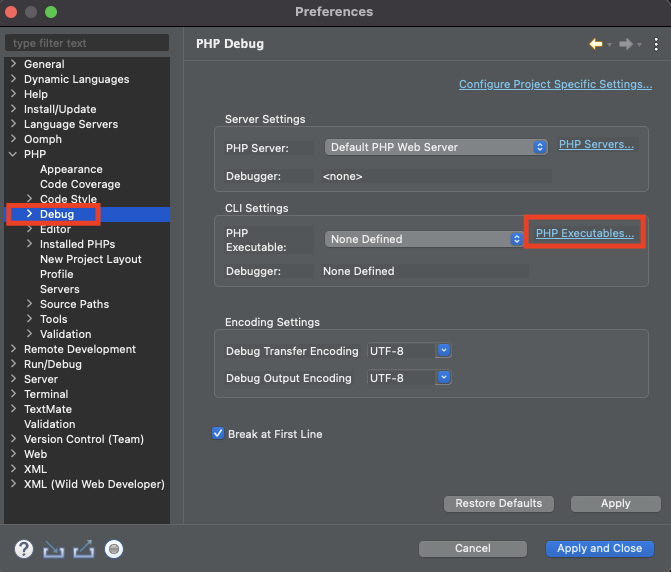
Configure Server Settings: PHP Executable
With the Document Root root and PHP Server configured, we can now proceed to specify the PHP Executable to be used by our project. Navigate to Eclipse > Preferences > PHP > Debug. Next in the Server Settings section click on PHP Executables. Please see the screenshot below:
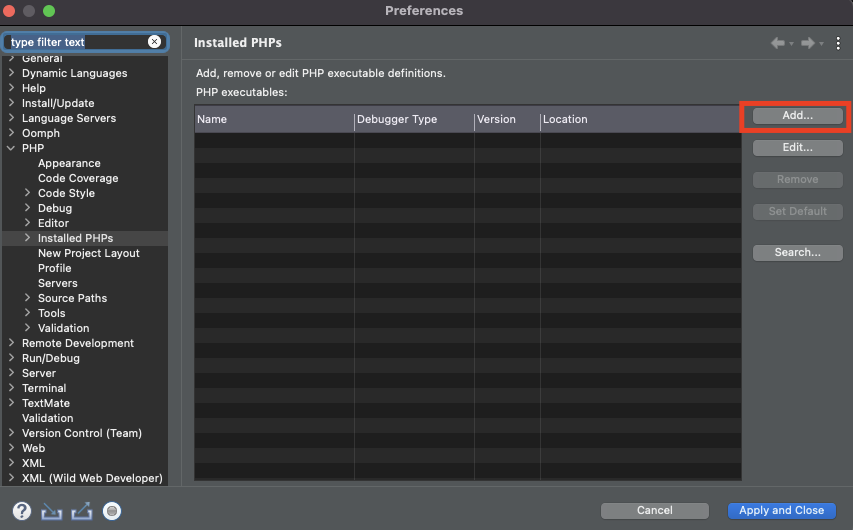
With the Installed PHPs dialog open, please click the Add… button to specify a new PHP Executable. Please see the screenshot below:
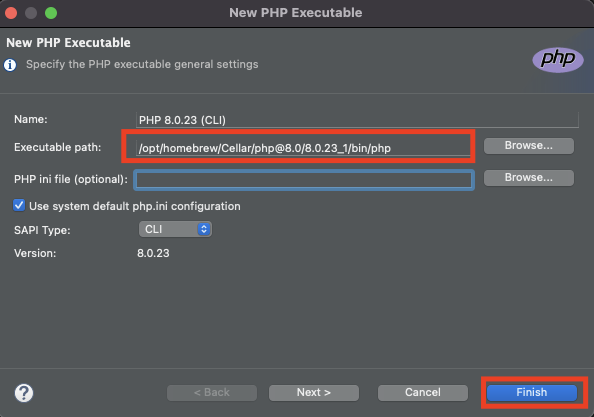
With the New PHP Executable dialog open, specify the Executable path, then click Finish. Please see the screenshot below:
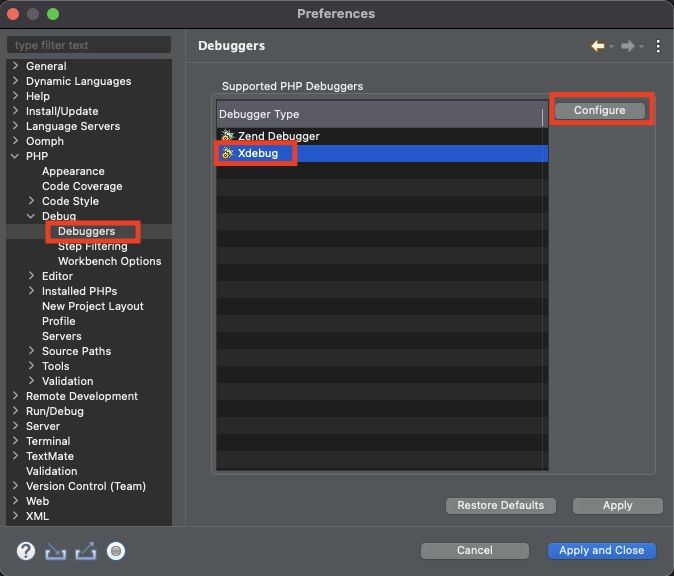
From here, we would need to configure Xdebug. Navigate to Eclipse > Preferences > PHP > Debug > Debuggers. Then from the list of selected debuggers, select Xdebug and click Configure. Please see the screenshot below:
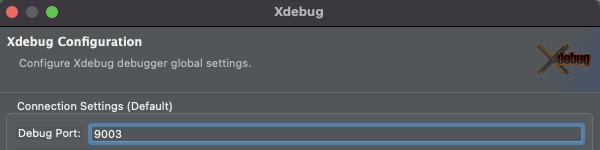
Next, ensure your Debug port matches the one reported by the phpinfo() function. In this case, mine was on port 9003, so I changed the default 9000 to 9003. Please see the screenshot below:
Starting and Stopping a Debugging Session
Before we dive into the debugging process, let’s start by learning how to start and stop a debugging session. The best and most direct way to start a debugging session is to set an Xdebug session cookie.
To do so, at the end of your desired project URL add the following parameters:
?XDEBUG_SESSION_START=helloto start a debugging session?XDEBUG_SESSION_STOPto end a debugging session.
Note: hello in ?XDEBUG_SESSION_START=hello can be any string you like.
For example, if you want to start to debug a script which is located at http://localhost/script.php, you would visit this URL in your browser:
http://localhost/script.php?XDEBUG_SESSION_START=session1
To stop that session, you would visit this URL in the browser:
http://localhost/script.php?XDEBUG_SESSION_STOP
Navigation hints within Eclipse: Use F5 to Step Into, F6 to Step Over, F7 to Step Out, and F8 to Resume when going through your scripts step by step.
Debugging a single PHP File
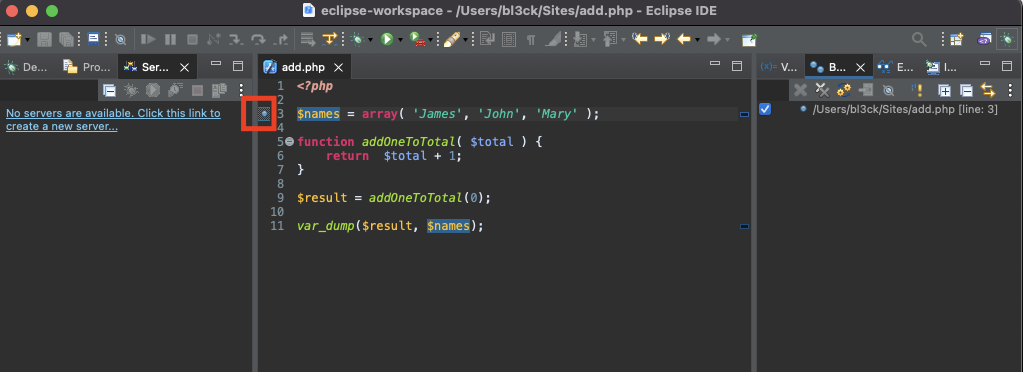
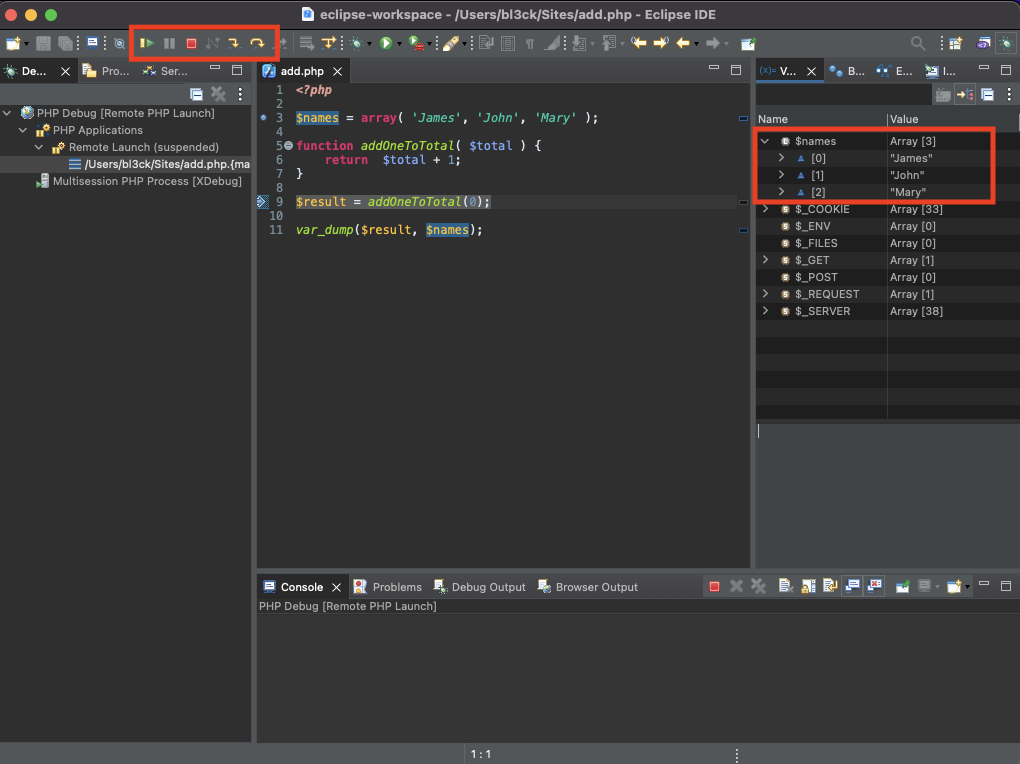
With the basics covered let’s create and open a simple PHP file called add.php in our Document Root with the following code:
<?php

$names = array( 'James', 'John', 'Mary' );

function addOneToTotal( $total ) {
    return  $total + 1;
}

$result = addOneToTotal(0);

var_dump($result, $names);
In order to debug our code, let’s add a breakpoint on the line where the $names variable is declared and initialized. To do so, double-click on a line number on the left in the editor on the line of interest. In this case Line 3. Please see the screenshot below:
Next, open your browser and visit the following URL:
http://localhost/add.php?XDEBUG_SESSION_START=hi
This is essentially going to set the Xdebug cookie and start our debugger.
In order to see how our code executes and how the variables are changing, let’s step over the instruction on line 3 by pressing F6. You’ll notice the variables tab now contains our $names variable as well as its content and other global variables like $_COOKIE and $_ENV. Furthermore, notice that Eclipse provides you with options to Step over, Step into, Pause, Stop and Resume your debugger.
Debugging WordPress with Eclipse and Xdebug – How to debug a simple Plugin
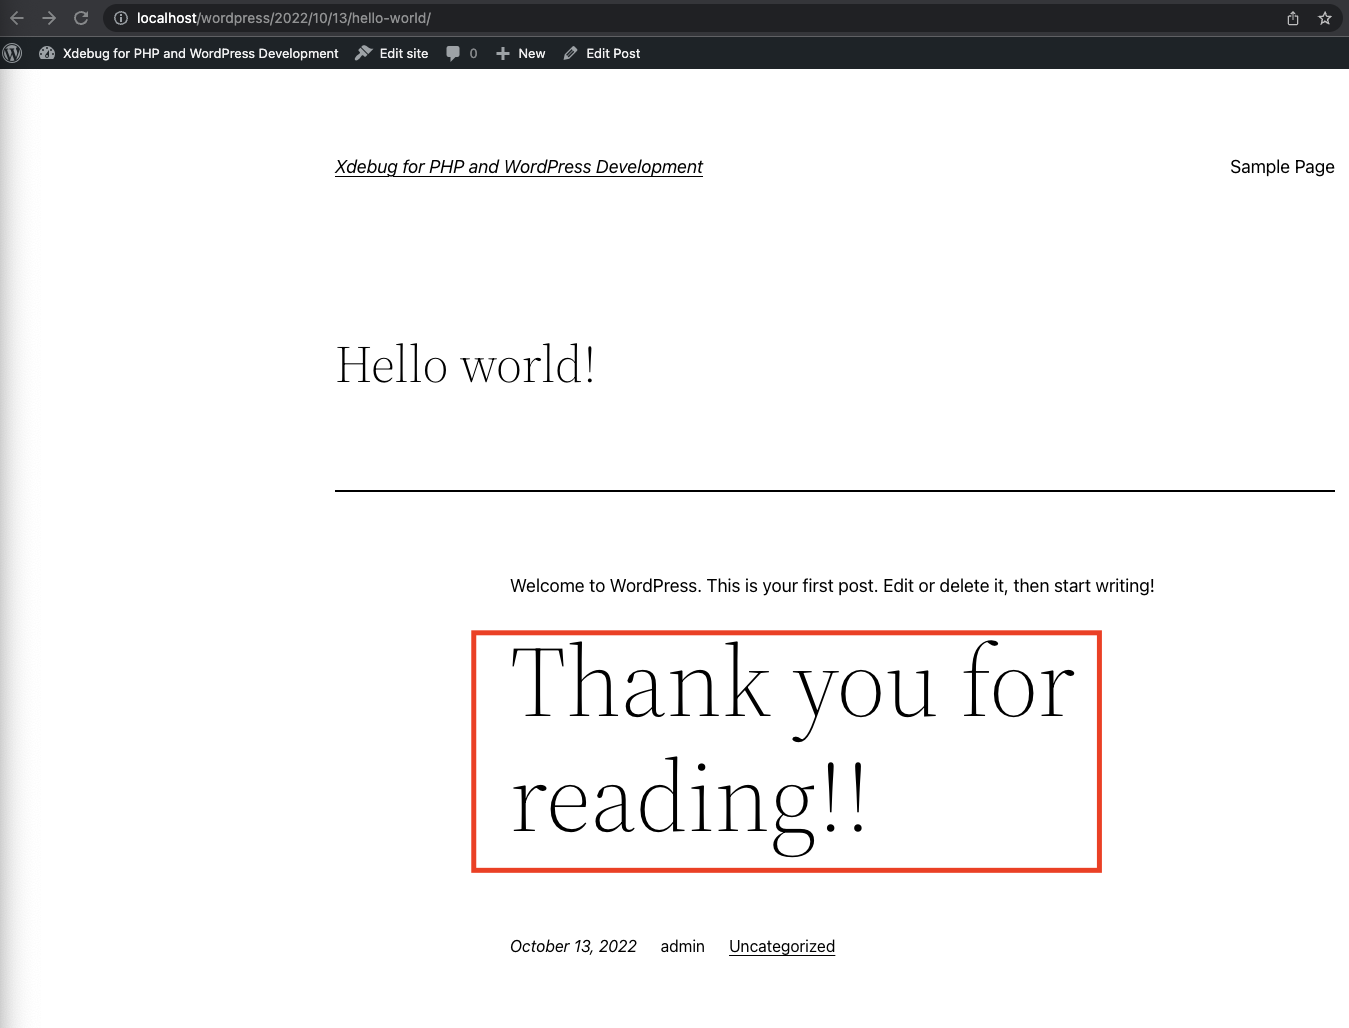
Our next example demonstrates how you can go about debugging a very simple plugin. I’ve gone ahead to create a plugin called Very Simple Plugin that uses the_content hook and appends an h1 tag with content, “Thank you for reading!!” after every post content.
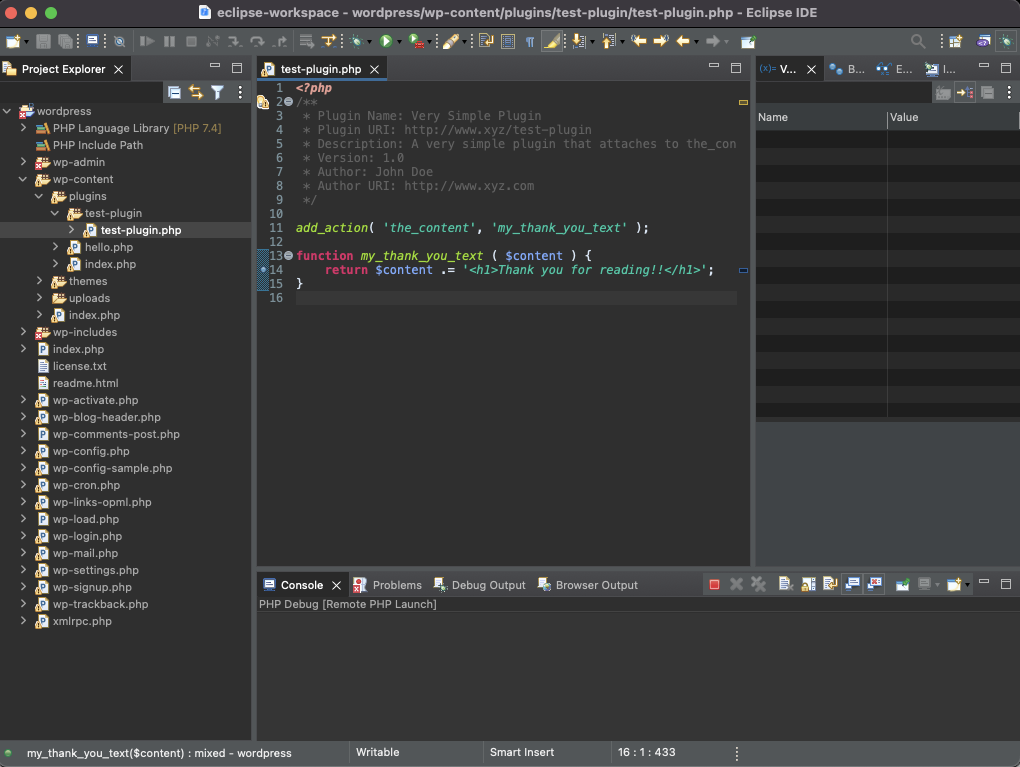
With our plugin implemented and a breakpoint added on line 14. Let’s activate our plugin and visit the default Hello World post to see it in action.
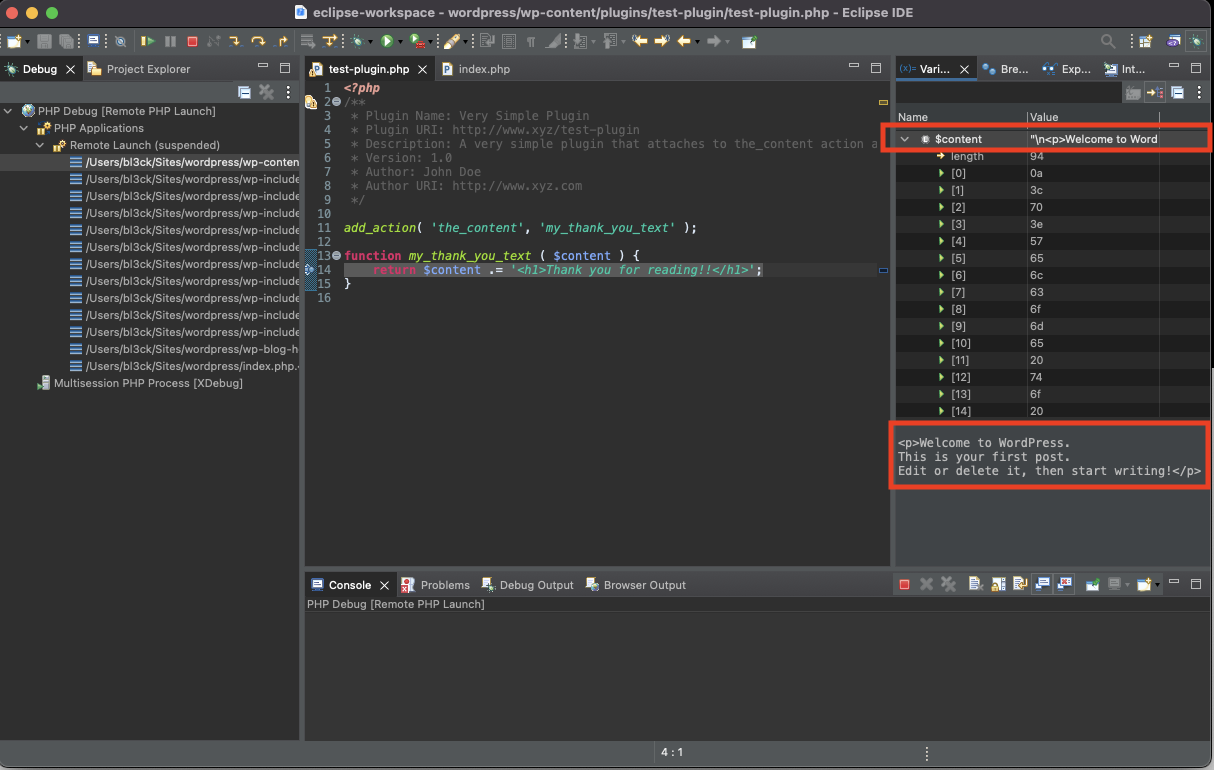
Notice that after line 14 is executed the value returned for $content should now be “Welcome to WordPress. This is your first post. Edit or delete it, then start writing! Thank you for reading!!“
To see this, let’s step over line 14 to execute the code.
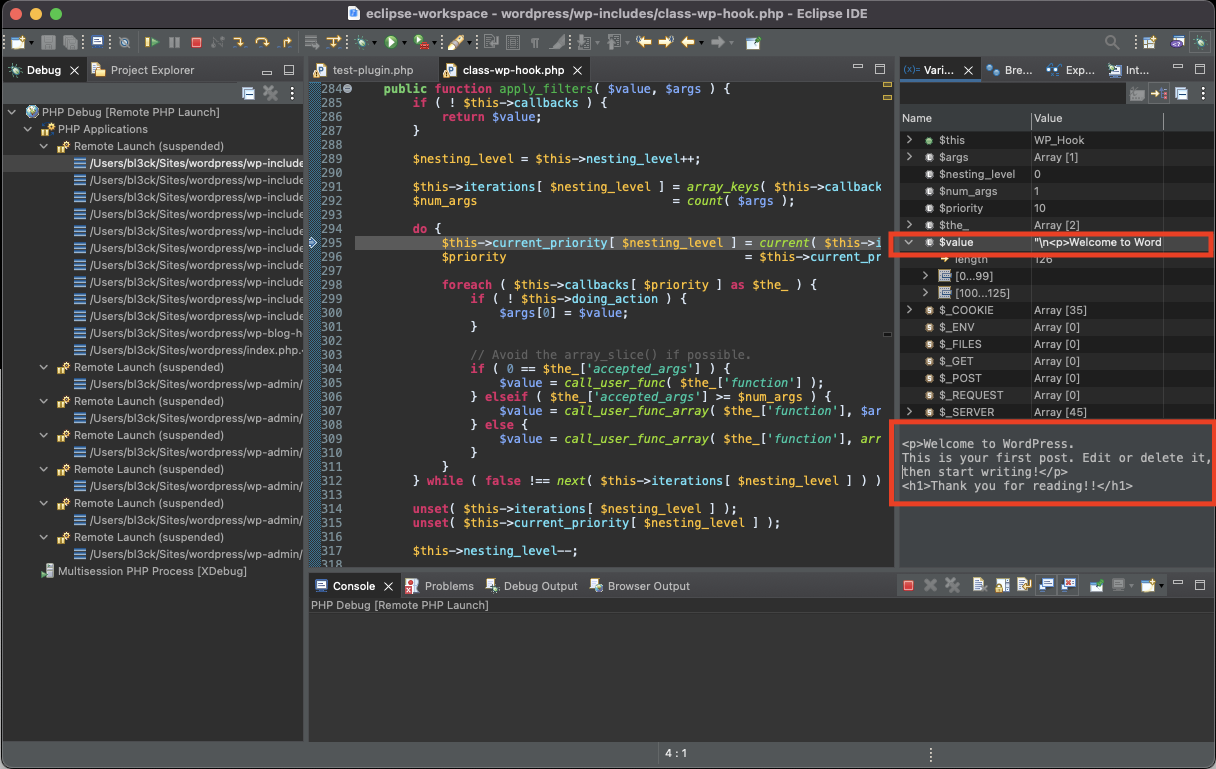
Notice how the content gets updated and you can follow the execution flow line after line. And on the front end, you’ll notice how the changes are reflected. Because we added Thank you for reading!! as an h1 tag. Notice how it stands out at the end of the post content.
This now opens doors to so many possibilities. Be it a plugin that depends on some other plugin, or a complex solution you are working on – you can now carefully use these tools to pinpoint the exact location of a bug or follow the program flow.
Happy debugging!
Leave a Reply